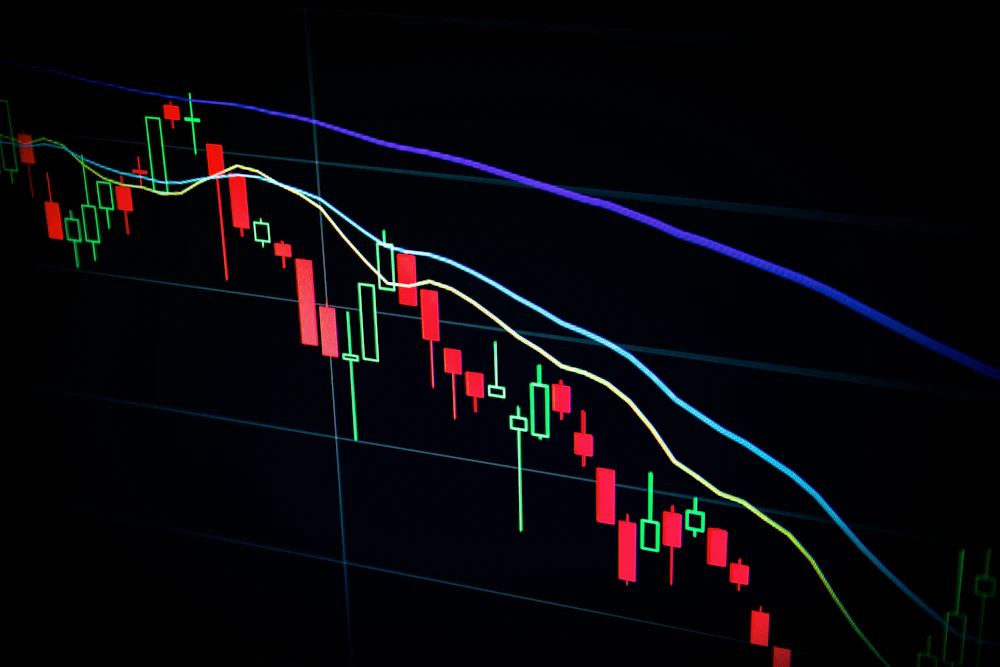
Every technical analyst has experienced the frustration of buying a textbook breakout above a multi-week resistance level, only to watch the market reverse within hours and trigger their stop-loss. In retail charting literature, this is often dismissed as bad luck or market noise. In our technical laboratory at DataTrail Base, we examine these events through the lens of structural liquidity distribution.
A liquidity sweep occurs when price is pushed beyond an obvious visual swing point specifically to trigger resting buy-stop orders and induce late momentum buyers. Once the opposing liquidity has been absorbed by large institutional participants seeking to fill substantial sell orders at premium prices, the market rapidly retreats back inside the previous range.
To distinguish between a genuine trend continuation breakout and an engineered sweep, look closely at the closing characteristics of the breakout candle. When a daily candle pierces a high but closes with an extended upper shadow (wick) that accounts for more than 60% of the total candle range, the probability of structural exhaustion increases dramatically. Pairing this candlestick footprint with volume divergence on the lower execution timeframes provides the necessary confirmation to avoid costly traps.
